


How I got here
I started in hospitality, where you learn fast that good service means actually listening to what people need. I took that into insurance, first as an analyst, then at a startup where I went from analyst to data engineer to data product manager and led integrations that had to work under real pressure.
That's where I learned to talk to engineers and executives without losing either one. It's also where I learned that most data problems aren't technical. They're communication problems wearing a technical costume.
Data visualization taught me the last piece. A picture is the language both sides read. IndieVisual is that job, the translator, done for organizations that don't have someone to do it, and done so the tool carries the translation after I'm gone.
Now I work with organizations that have outgrown spreadsheets but don't have a data or product team of their own. Insurance brokerages, financial advisory firms, government and education programs. I figure out what they have, design what should be there, build it, and stay until people are using it.
Talks
Meeting users where they are
-
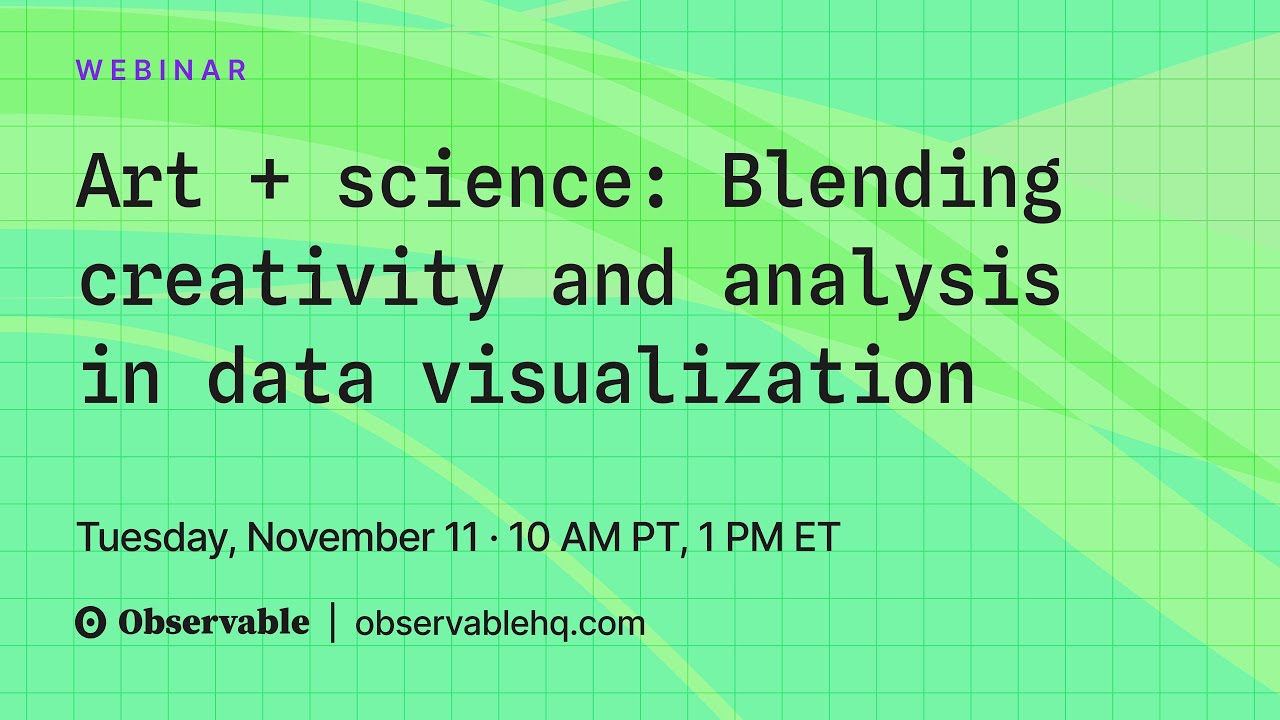 Art + Science Panel
-
 Plot Twist Conference
-
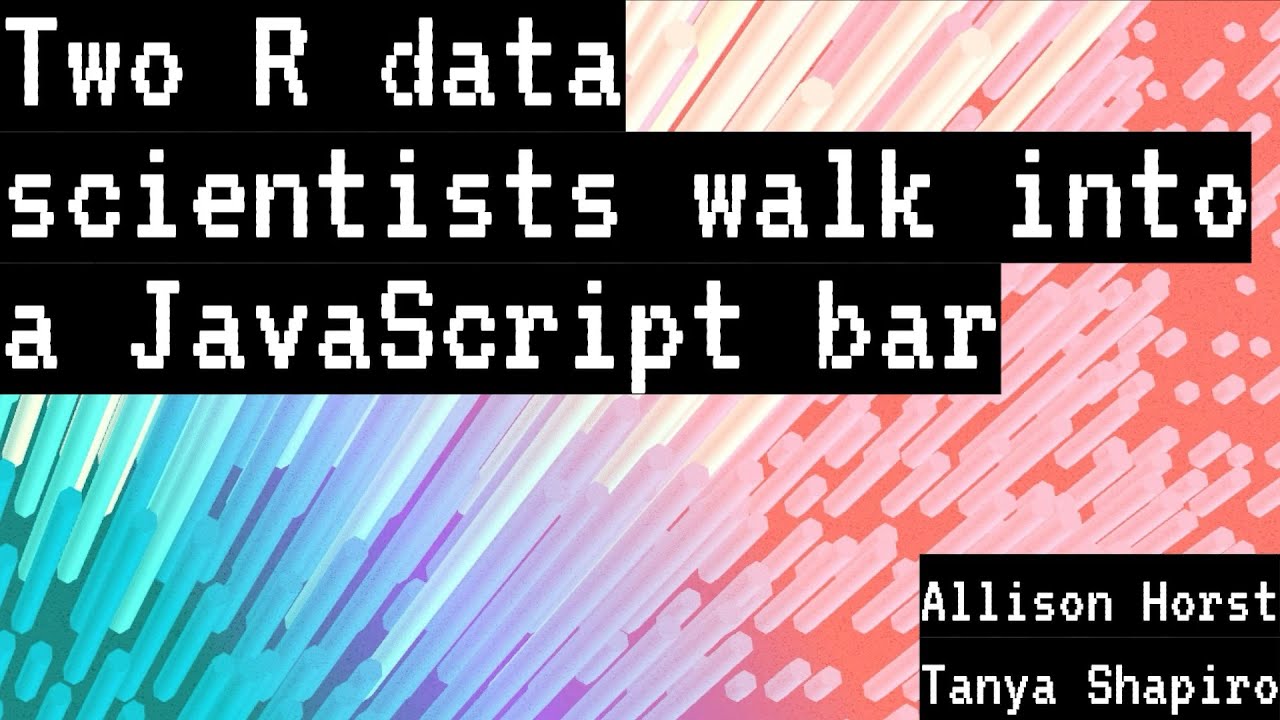 Observable Insights 2024 Conference
-
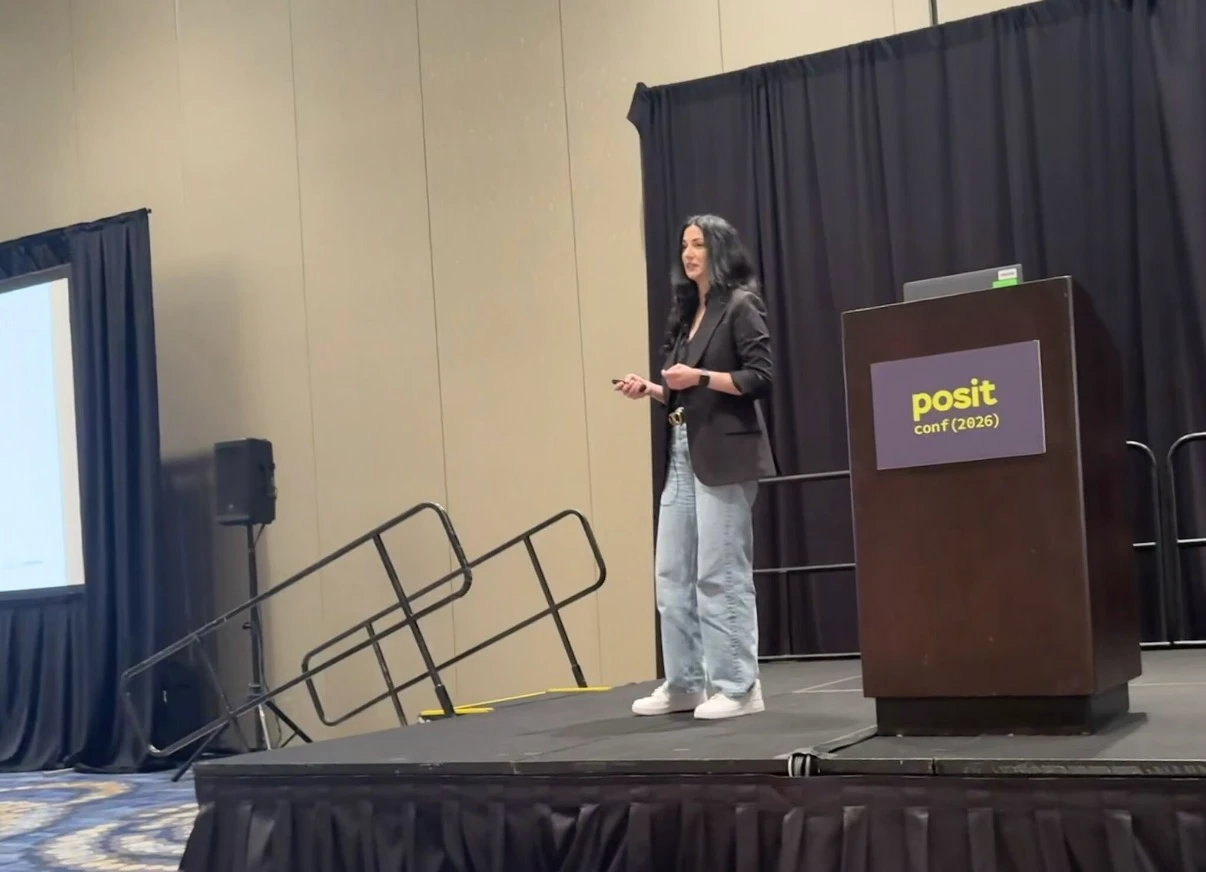 posit::conf 2026 Recording coming
Let's talk
Got a data problem? Let's talk.
Tell me what's going on. No commitment, no forms that take 10 minutes.
Rather talk it through? Pick a time. Not ready to talk? Take the two-minute quiz.